


EMPLOYEE HEALTH & WELLNESS CHECKUP
How supportive companies are of health and wellness goals, according to employees:
| Gender Male | Gender Female | Age 18-34 | Age 35-54 | Age 55+ | ||
|---|---|---|---|---|---|---|
| Very supportive | 57% | 42% | 57% | 45% | 47% | |
| Somewhat supportive | 35% | 43% | 36% | 42% | 39% | |
| Somewhat unsupportive | 4% | 8% | 5% | 6% | 7% | |
| Not supportive at all | 4% | 6% | 1% | 7% | 8% |
Workers’ biggest obstacles to achieving their health and wellness goals:
| Gender Male | Gender Female | Age 18-34 | Age 35-54 | Age 55+ | ||
|---|---|---|---|---|---|---|
| Food at office celebrations | 26% | 34% | 30% | 28% | 32% | |
| Snacks brought in by coworkers | 20% | 23% | 16% | 23% | 30% | |
| Free meals | 10% | 11% | 11% | 10% | 10% | |
| The vending machine | 11% | 9% | 10% | 12% | 5% | |
| The office candy jar | 9% | 10% | 8% | 10% | 10% | |
| Happy hours/after-work drinks | 11% | 5% | 12% | 8% | 1% | |
| Business trips | 10% | 5% | 9% | 6% | 10% | |
| Bagel Mondays | 3% | 2% | 4% | 2% | 2% |
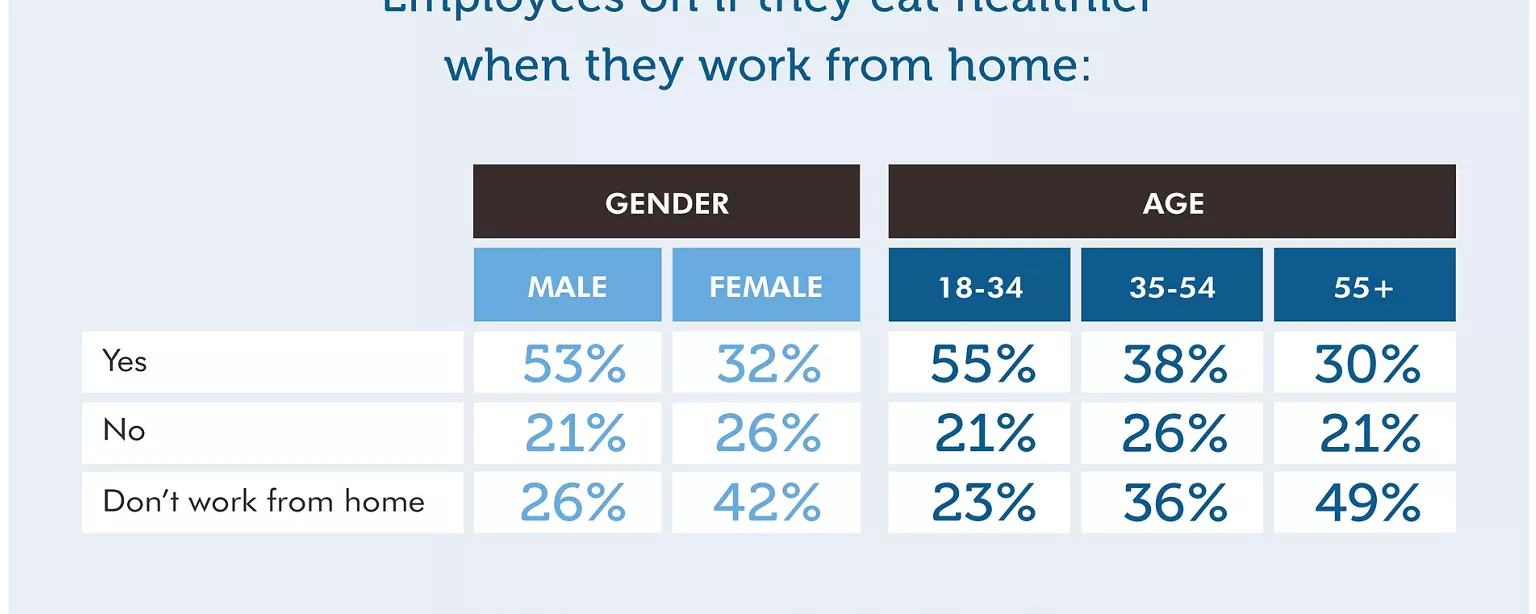
Employees on if they eat healthier when they work from home:
| Gender Male | Gender Female | Age 18-34 | Age 35-54 | Age 55+ | ||
|---|---|---|---|---|---|---|
| Yes | 53% | 32% | 55% | 38% | 30% | |
| No | 21% | 26% | 21% | 26% | 21% | |
| Don’t work from home | 26% | 42% | 23% | 36% | 49% |
What workers do for lunch:
| Gender Male | Gender Female | Age 18-34 | Age 35-54 | Age 55+ | ||
|---|---|---|---|---|---|---|
| Bring their own meal | 48% | 73% | 52% | 61% | 75% | |
| Grab something and bring it back to the office | 20% | 15% | 18% | 19% | 13% | |
| Dine at a restaurant | 17% | 6% | 15% | 10% | 10% | |
| Have food delivered | 10% | 4% | 11% | 6% | 2% | |
| Choose something from the vending machine | 4% | 2% | 4% | 4% | 0% |
How employees feel about the office candy jar:
| Gender Male | Gender Female | Age 18-34 | Age 35-54 | Age 55+ | ||
|---|---|---|---|---|---|---|
| It’s great to have around for a quick pick-me-up! | 61% | 45% | 62% | 52% | 38% | |
| I have a love-hate relationship with it. | 26% | 41% | 30% | 34% | 37% | |
| It’s bad news — I don’t want it around. | 12% | 14% | 8% | 13% | 26% |
Source: OfficeTeam survey of 1,006 workers in the United States.
Some responses do not total 100 percent due to rounding.
© 2018 OfficeTeam. A Robert Half Company. An Equal Opportunity Employer M/F/Disability/Veterans.